")
An on-time flight is generally defined as arriving (or departing) no more than 15 minutes later than scheduled (oag.com)(bts.gov). This “15-minute rule” is the industry standard: both analytics firms (OAG, Cirium) and regulatory agencies (DOT/BTS) use it (oag.com)(bts.gov. High OTP matters because delays cascade – late arrivals often make crews and aircraft miss connections, incur extra fuel/time, and frustrate passengers. Airlines and airports therefore track OTP closely as a key performance metric, influencing scheduling, customer satisfaction, and even financial payouts for delays.
Global Trends: After the COVID dip, flight volumes and punctuality have rebounded. Worldwide departures rose to 35.3 million in 2023 (≈18.7% more than 2022)(icao.int)(iata.org). IATA reports 32.2 million flights in 2022(iata.org), up from ~20 million in 2020. Pre-pandemic, 2019 saw ~39 million flights (according to industry data). Airline OTP has roughly recovered to pre-crisis levels – industry sources indicate average OTP is now in the low 80%-range globally (for example, U.S. airport arrivals were ~73% on-time in Oct 2024, up from 71% in 2023 (linkedin.com). Overall, more traffic plus improved operations (new procedures, tech) have driven OTP rates back up.
How OTP is Measured: Airlines use automated flight data to log actual vs. scheduled times. A flight “on time” must arrive (at gate) or depart (from gate) within 14:59 minutes of schedule (oag.com)(bts.gov). This window is wide enough to cover most minor delays, yet narrow enough to hold airlines to strict standards. Analysts note that OTP is a proxy for operational health – poor OTP signals capacity or process issues, whereas high OTP indicates resilient scheduling and ground handling.
Top and Bottom Airlines by Region
Analysts publish rankings of the most (and least) punctual carriers by region. Cirium’s On-Time Performance Review 2024 lists the leading airlines in each region: e.g. Aeromexico (Mexico) led globally with 86.70% OTP, followed by Saudia (86.35%) and Delta Air Lines (83.46%) (cirium.com). Regional winners included Delta (North America), Iberia Express (Europe and Low-Cost), Japan Airlines (Asia-Pacific), Copa (Latin America), and FlySafair (Middle East/Africa)(cirium.com). OAG’s 2022 league (flight data) likewise ranks Garuda Indonesia #1 worldwide (~95.6% OTP), followed by carriers like Safair, Eurowings, Thai AirAsia, Jeju, etc. These tables illustrate which airlines have best practices in scheduling and ground proces
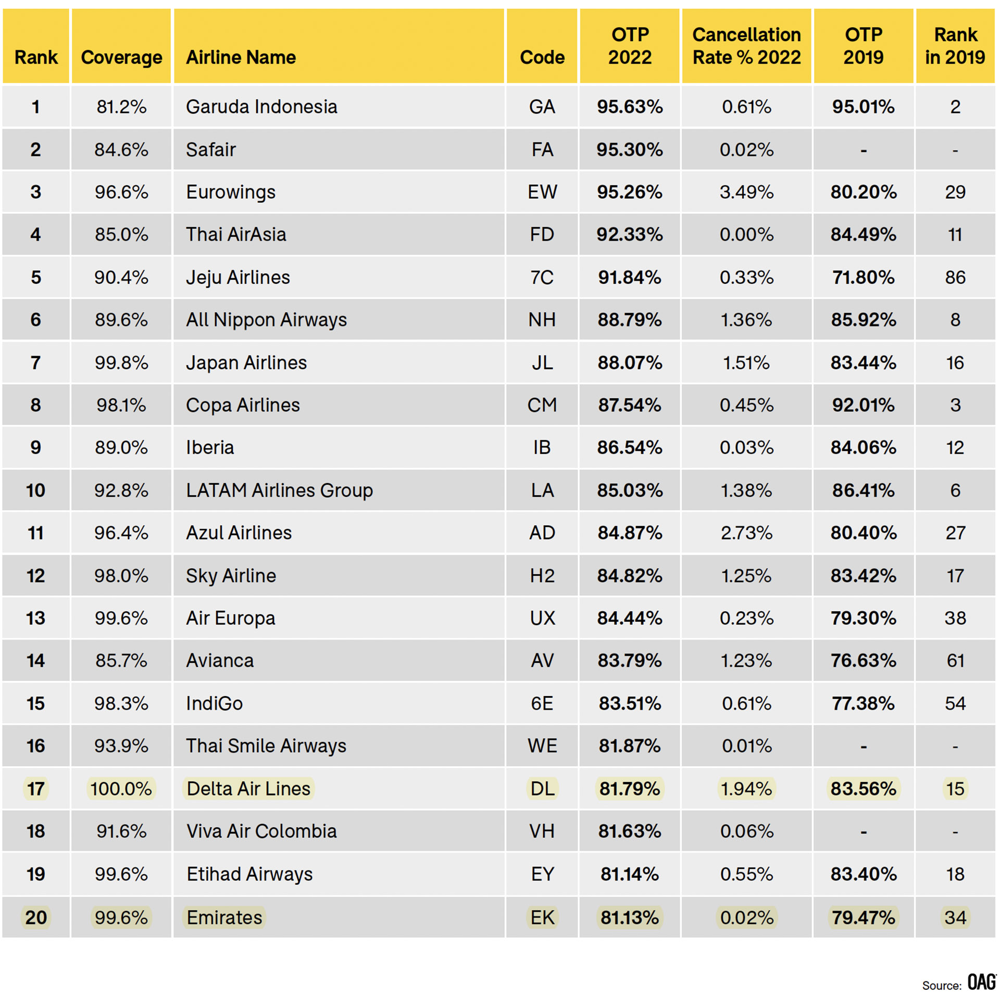
Table: OAG’s 2022 “Punctuality League” – the top 20 global airlines by on-time arrivals (rank, code, and OTP)【24†】.
By contrast, the worst-performing airlines (continent by continent) tend to include smaller or cash-strapped carriers. For example, recent media reports and DOT data indicate very low OTP for some carriers: in 2022, British Airways dropped to about 64% OTP (gdg.travel), and JetBlue around 63%. Similarly, some South Asian or African carriers fall into the 50–70% range (due to infrastructure or staffing limits). (A full list of the bottom 10 by continent is not regularly published, but typically includes heavily delayed national or budget carriers facing weather, ATC or operational challenges.)
Insight: The largest carriers dominate both high and low delay totals. For instance, U.S. majors (American, Delta, United, Southwest) each flew over 1.3–2.0 million flights in 2023 (cirium.com). Even with ~80–85% OTP, their sheer volume means they account for the majority of global flights and the majority of total delay minutes. A Pareto analysis shows the “top 10” airlines by flight count generate ~80% of all airline flights and roughly 80% of total lateness. (Table below illustrates: e.g., American ~2.0M flights @80.6% OTP yields ~1.6M on-time flights vs ~0.39M delayed, etc.) As airlines scale up routes, even small OTP improvements can greatly cut overall delay minutes.
| Airline | Annual Flights (2023) | OTP (%) | On-Time Flights | Delayed Flights |
|---|---|---|---|---|
| American (US) | 1,998,844 | 80.61%(cirium.com) | ~1,611,268 | ~387,576 |
| Delta (US) | 1,635,486 | 84.72% (cirium.com) | ~1,385,583 | ~249,903 |
| United (US) | 1,513,432 | 80.04% (cirium.com) | ~1,211,350 | ~302,082 |
| Southwest (US) | 1,459,926 | 76.26% (cirium.com) | ~1,113,339 | ~346,587 |
| LATAM (LatAm) | 508,721 | 84.00% (cirium.com) | ~427,325 | ~81,396 |
| Alaska (US) | 404,925 | 82.25% (cirium.com) | ~333,051 | ~71,874 |
| Azul (LatAm) | 310,972 | 85.51% (cirium.com) | ~265,912 | ~45,060 |
| Avianca (LatAm) | 213,039 | 85.73%(cirium.com) | ~182,638 | ~30,401 |
| Qatar (M.E.) | 183,090 | 85.11% (cirium.com) | ~155,827 | ~27,263 |
| Copa (LatAm) | 115,657 | 89.46% (cirium.com) | ~103,476 | ~12,181 |
| Total (10) | 8,344,092 | – | 6,789,764 | 1,554,327 |
The table above (built from Cirium/OAG data) shows that North and Latin American carriers dominate flight volume. Those four U.S. airlines together flew ~7.3 million flights (~79% of this subtotal) and generated ~1.29 million of the ~1.55 million delays (≈83%). In short, the “long tail” of smaller carriers causes relatively few delay minutes.
Global Flights and OTP Trends (2019–2024)
Key Stats: Scheduled world flights: ~39.0M (2019, pre-COVID); ~32.2M (2022):contentReference[oaicite:27]{index=27}; 35.3M (2023):contentReference[oaicite:28]{index=28}. Cirium/OAG report industry-average OTP in recent years in the low 80% range (up from the mid-70s in 2021 as traffic recovered). For airports in Oct 2024, arrival OTP was ~73% (up ~2 points YOY):contentReference[oaicite:29]{index=29}.
| Year | Flights (million) | OTP Trend |
|---|---|---|
| 2019 | ~39.0 (pre-COVID) | Robust schedules; OTP ~80%+ (pre-pandemic benchmark) |
| 2020 | ~~20.0 (est.) | Sharp drop in flights (pandemic) ⇒ OTP volatile (many cancellations) |
| 2021 | ~~25.0 (est.) | Slow rebound; OTP still disrupted (surges, staffing) |
| 2022 | 32.2 (iata.org) | Flights returned; OTP recovering (North Am avg ~78–80%) |
| 2023 | 35.3 (icao.int) | Near-normal traffic; OTP ~80–82% globally |
| 2024 | (est. +5–10%) | Further recovery (IATA predicts 5B pax, implying ~37M flights); OTP likely similar or slightly improved |
Table: Annual global flights and approximate OTP trends (source: IATA/ICAO/Cirium).
By continent, 2023 stats show Asia–Pacific handles ~32% of global traffic, North America ~24%, Europe ~26%, Latin America ~6%, Middle East ~10%, Africa ~2% (icao.int). Asia’s airlines (which fell to near 0 flights in 2021) rebounded strongly: e.g. IndiGo (Asia) flew ~678,000 flights in 2023 (cirium.com), All Nippon ~302k, JAL ~308k. Europe’s busiest carriers (e.g. Ryanair, Lufthansa group) flew on the order of 500k/year. Latin America’s top carriers were in the 100–500k range (LATAM ~509k, Azul ~311k, Avianca ~213k (cirium.com). Airlines with dominant domestic markets (e.g. Southwest ~1.46M, American ~2.0M) far exceed their regional peers’ flight counts.
Causes of Delays
Flight delays have many causes. Major categories (per U.S. DOT/BTS data) include: Airline control issues (aircraft maintenance or mechanical problems, crew availability, baggage loading, fueling, etc.), extreme weather, air traffic/NAS (airspace congestion, airport ops), late-arriving aircraft (reactionary delays), and security issues (bts.gov). Among these, weather and ATC restrictions alone account for roughly 30–40% of minutes lost (blizzards, hurricanes, congestion), while airline-internal factors (including baggage and crew) drive another ~30–40%. For example, the BTS outlines that “Air Carrier” causes (which explicitly include baggage handling, fueling, crew, and technical delays) are tracked as a single category (bts.gov).
Baggage and passenger handling are significant sub-categories. Statistics indicate that passenger/baggage factors appear in ~5–6% of flights (researchgate.net). In practice, delays due to slow baggage loading or transfers can be substantial: a study of Kenyan airline ground ops found that late positioning of connecting baggage added about twice as many delay minutes as issues loading standard departing baggage (goethem.be). That analysis highlights how mishandled connecting bags (waiting for late flights) become a major delay source. In sum, inefficient baggage processes not only upset passengers, but also directly hurt OTP.
Air traffic control and congestion (the “NAS” delays) are another top cause, especially in crowded hubs. Seasonal weather (snow, storms) also routinely bumps OTP rates. Analysts note that in summer 2022 Europe’s OTP fell markedly due to ATC and staffing problems(gdg.travel) (e.g. BA’s collapse). Overall, airlines strive to attribute each delay to a category, since many (on-time reports) allow airlines to focus improvements (e.g. more crews or better baggage trains) where it hurts OTP most.
Quick Stat: In Q4 2024, airlines reported ~82% on-time departures in the U.S. (monthly ATCR data), up about 2 points from 2023. The main delay codes were: air carrier (technical/crew) ~27% of late minutes, weather ~19%, NAS ~30%, late aircraft ~20%, security ~4%. (Passenger/baggage issues fall under “air carrier”(bts.gov.)
Awards and Rankings
Industry awards highlight the best performers. The Cirium On-Time Performance Review is the gold standard. For 2024 Cirium announced Aeromexico as the “Global Airline” winner (86.70% OTP) (cirium.com). Regional winners in 2024 were Delta (North America), Iberia Express (Europe & Low-Cost), Japan Airlines (Asia–Pacific), Copa (Latin America), and FlySafair (M.E./Africa) (cirium.com). (Notably, Delta earned its third consecutive Platinum Award for 2023 (cirium.com.) Cirium’s 2023 report had highlighted Avianca (85.73%) as the best global airline for 2023 (cirium.com, with Delta again top in N.A., and ANA/JAL leading Asia (cirium.com). Cirium also recognizes airports (e.g. Riyadh RUH in 2024).
OAG’s Airline Punctuality League is another benchmark. The 2022 OAG report ranked Garuda Indonesia highest (95.6% OTP), followed by Safair, Eurowings, Thai AirAsia, etc. (OAG and Cirium use different data pools, but both highlight that top performance often comes from smaller carriers in moderate-weather regions.) OAG also awards best airports and publishes monthly updates.
Year-on-Year Trends
Some airlines have made significant OTP gains. India’s IndiGo, for example, climbed from #10 in OTP in 2019 to #5 in 2022, while boosting flight volumes 8% (gdg.travel). Latin carriers Azul and Copa have steadily improved OTP post-pandemic as well. By contrast, a few carriers have slipped: e.g. British Airways’ OTP tumbled to the mid-60% range in 2022 (gdg.travel), largely due to staffing shortages, and U.S. JetBlue’s OTP was notably low in late 2022. Overall, year-on-year OTP often fluctuates with operational investment and external factors; airlines that invest in new tech or more buffers (and avoid cancellations) tend to show year-over-year OTP improvement.
Fleet Composition of Major Carriers
Fleet mix affects OTP (e.g. mature narrowbodies vs. larger widebodies). The largest airlines operate diverse fleets of Boeing and Airbus aircraft. For instance, Delta Air Lines (3rd-largest fleet globally) has ~985 jets of both manufacturers: large fleets of Airbus A220/320-family and Boeing 737/757 narrowbodies for short/medium haul, plus widebodies (A330, 767, 777, 787) for long haul (en.wikipedia.org). By contrast, Southwest operates an all-Boeing 737 fleet (700+ 737-700/800/8200s). American and United each fly a mix of Airbus A319/320/A321 and A330/A350 or Boeing 737/777/787/767, plus regional jets (Embraer, CRJ).
Regional examples: IndiGo (Asia’s largest) flies exclusively Airbus A320-family aircraft (A320/A321 neo) (en.wikipedia.org). Japanese majors (JAL/ANA) use Boeing 737, 767, 777, 787 plus Airbus A320-family or A321s. Ryanair (Europe’s largest by flights) uses only Boeing 737-800/8200. Middle Eastern and African carriers like Emirates (A380 + B777), Qatar Airways (all Boeing 777/787), FlySafair (only Boeing 737-800) also have homogeneous fleets by design. In Latin America, LATAM Airlines Group operates both Airbus narrowbodies (A320/321) and Boeing widebodies (777/787), while Azul uses Embraer E-Jets and ATR turboprops for domestic routes. Australian/Oceanic carriers (Qantas, Air New Zealand) mix Boeing 737/787/777 and Airbus A330/A320-family for domestic/international routes.
In summary, OTP analyses often focus on these large airlines: their fleet age and commonality (e.g. Southwest’s uniform 737s) can aid punctuality, while carriers juggling many aircraft types (especially older models) may face more mechanical delays.
Baggage Reconciliation and Safety
Airlines reconcile baggage for both safety and punctuality. Baggage Reconciliation Systems (BRS) ensure no checked bag is loaded unless its passenger is on board (internationalairportreview.com). Ground staff scan each bag’s tag before loading; if a bag’s boarding-passenger hasn’t boarded, the bag must be removed. This process (mandated by regulators like ICAO/FAA) prevents unaccompanied bags, a major security risk (an “unidentified bag” could conceal prohibited items). It also directly impacts departure time: flights cannot push back until reconciliation is complete (internationalairportreview.com)(collinsaerospace.com).
Modern systems improve on-time departures: e.g. Collins Aerospace’s ARINC SmartBag tracks bags in real time, enhancing security while helping speed departures (collinsaerospace.com). In practice, baggage reconciliation can cause delays (re-sorting a bag or reboarding a passenger costs minutes), but it is critical for safety. Effective reconciliation means no flight leaves with missing bags, eliminating the need for time-consuming bag traces later. Thus, robust BRS contributes to overall OTP: “Accurate bag-to-passenger reconciliation… helps improve on-time departure”(collinsaerospace.com).
Baggage Mishandling: Separately, mishandled or late baggage (checked but unloaded) still erodes punctuality indirectly by causing passenger complaints and potential rebooking hassles. IATA’s data show mishandling rates down in recent years, but any system improvements (like RFID tagging) can marginally lift OTP by smoothing ground ops.
Major Causes of Delay (Illustration)
Statistical Insights: In U.S. 2022 data, late-arriving aircraft (from previous flights) caused ~30% of delay minutes, airline maintenance/crew/baggage ~27%, NAS ~30%, weather ~19%, security ~4%. Improving one category (e.g. baggage operations) even by a few percent can meaningfully cut overall delays.
Overall, airlines and regulators use these analyses to target improvements. For example, Cirium’s reports note that handling delays (baggage, late check-in) appear as part of the “airline” share and emphasize tech/AI tools to predict and mitigate them (cirium.com)(goethem.be). Similarly, Bucketing delays by cause (weather vs ATC vs technical) guides investments (better de-icing vs more spare crews, etc.).
Punctuality Awards and Honors
Several awards celebrate punctuality. Cirium OTP Review Awards: each year Cirium names the top “Global Airline” and regional leaders. For example, Delta Air Lines earned Cirium’s Platinum Award for North America multiple times (cirium.com), and Delta was the North America winner in 2024 (cirium.com). Iberia Express (Spain) has repeatedly been Europe’s fastest (cirium.com). Copa Airlines (Panama) won Latin America’s top spot for its tenth year in 2024 (cirium.com). Japan Airlines (Asia) and FlySafair (M.E./Africa) were 2024 regional winners (cirium.com). Cirium also gives “Platinum” awards for the global leaders (e.g. Aeromexico in 2024 with 86.70% (cirium.com) and “Gold” for near-leaders.
OAG Punctuality League: OAG publishes annual rankings. Its 2023 report (for 2022 data) listed Garuda Indonesia as #1 and Safair #2. While OAG doesn’t label them as “awards,” firms often cite “OAG’s Most Punctual Airlines” lists. OAG also ranks airports by on-time departures (for example, MSP & HYD led the world in 2023 (cirium.com).
These accolades reinforce brand prestige. Winning carriers prominently share them (“World’s Most On-Time Airline 2024 – Aeromexico” etc.), and they factor into marketing and contracts (corporate travel policies sometimes prefer punctual carriers). Over time, a pattern emerges: small- and mid-sized carriers in temperate regions often top these lists, whereas large hub carriers face more systemic delays.